Establishing clinical equivalence
Phase l Clinical Study:
A randomized, double-blind, single-dose, three-arm, parallel study to compare the pharmacokinetic profiles of TOFIDENCE and reference tocilizumab1
TOFIDENCE demonstrated a comparable pharmacokinetic profile vs rTCZ1
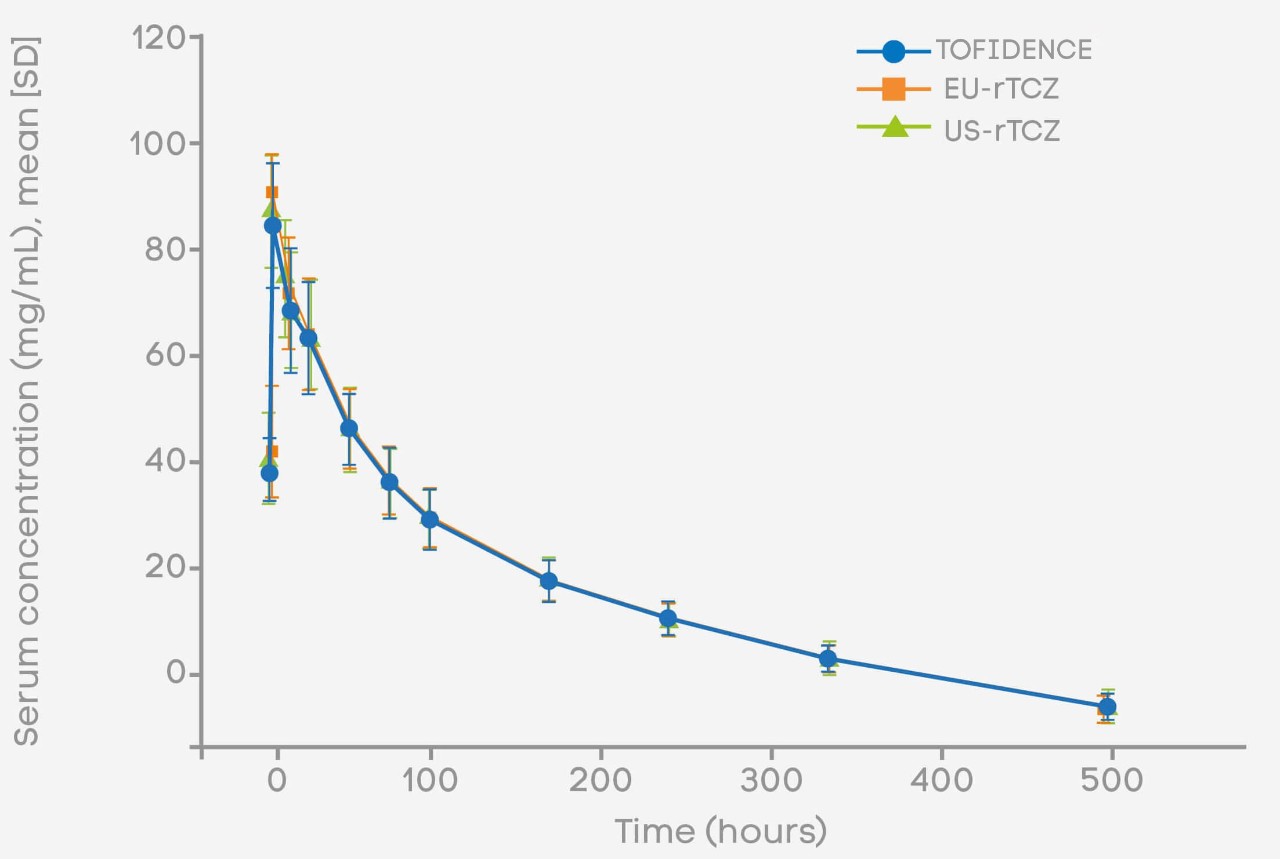

Mean serum concentration-time profiles were similar for EU/US-reference tocilizumab and TOFIDENCE1
Adapted from: Zhang H, et al. 20211
All primary PK parameters* remained within the pre-defined equivalencea margin for TOFIDENCE and EU/US-reference tocilizumab1
| Parameter | TOFIDENCE (n=45) |
EU-rTCZ (n=42) | US-rTCZ (n=42) |
p-value | GMR (90% CI)b | GMR (90% CI)c | GMR (90% CI)d |
|---|---|---|---|---|---|---|---|
| AUC0-inf (µg*h/mL) | 10,840 (16.6) | 11,080 (19.5) | 10,690 (15.4) | 0.73 | 98.06 (92.10–104.41) |
100.82 (95.76–106.15) |
97.26 (91.75–103.10) |
| AUC0-t (µg*h/mL) | 10,260 (17.8) | 10,580 (21.5) | 10,390 (16.4) | 0.78 | 97.39 (91.01–104.20) |
98.18 (92.89–103.78) |
99.19 (93.22–105.53) |
| Cmax (µg/ml) | 88.28 (14.5) | 96.28 (17.6) | 91.29 (16.4) | 0.03 | 91.71 (86.90–96.79) |
96.25 (91.70–101.03) |
95.28 (90.04–100.82) |
| Tmax (h) | 2.0 (1.0–9.0) | 3.0 (1.0–5.0) | 4 (0.98–9.02) | NA | - | - | - |
| t1/2 (h) | 89.81 (32.4) | 82.08 (33.5) | 72.57 (30.7) | NA | - | - | - |
| CL (L/h) | 0.02457 (16.4) | 0.02421 (18.8) | 0.02482 (13.0) | NA | - | - | - |
| Vz (L) | 3.184 (32.9) | 2.867 (32.6) | 2.599 (32.4) | NA | - | - | - |
| AUCextrapolation (%) |
5.35 (18.2) | 4.51 (35.4) | 2.80 (30.0) | NA | - | - | - |
| Parameter | Tofidence™ (N=45) |
EU-rTCZ (N=42) | US-rTCZ (N=42) |
p-value | GMR (90% CI)b | GMR (90% CI)c | GMR (90% CI)d |
|---|---|---|---|---|---|---|---|
| AUC0-inf (μg*h/mL) | 10,840 (16.6) | 11,080 (19.5) | 10,690 (15.4) | 0.73 | 98.06 (92.10–104.41) |
100.82 (95.76–106.15) |
97.26 (91.75–103.10) |
| AUC0-t (μg*h/mL) | 10,260 (17.8) | 10,580 (21.5) | 10,390 (16.4) | 0.78 | 97.39 (91.01–104.20) |
98.18 (92.89–103.78) |
99.19 (93.22–105.53) |
| Cmax (μg/ml) | 88.28 (14.5) | 96.28 (17.6) | 91.29 (16.4) | 0.03 | 91.71 (86.90–96.79) |
96.25 (91.70–101.03) |
95.28 (90.04–100.82) |
| Tmax (h) | 2.0 (1.0–9.0) | 3.0 (1.0–5.0) | 4 (0.98–9.02) | NA | - | - | - |
| t1/2 (h) | 89.81 (32.4) | 82.08 (33.5) | 72.57 (30.7) | NA | - | - | - |
| CL (L/h) | 0.02457 (16.4) | 0.02421 (18.8) | 0.02482 (13.0) | NA | - | - | - |
| Vz (L) | 3.184 (32.9) | 2.867 (32.6) | 2.599 (32.4) | NA | - | - | - |
| AUCextrapolation (%) |
5.35 (18.2) | 4.51 (35.4) | 2.80 (30.0) | NA | - | - | - |
Adapted from: Zhang H, et al. 2021
*Median [min, max].
a Bioequivalence by ANOVA if the 90% CIs for the ratio of geometric LS-means of the treatments compared were completely contained within the pre-defined equivalence margin, 0.8–1.25.
b TOFIDENCE/ROACTEMRA-EU.
c TOFIDENCE/ACTEMRA-US.
d ACTEMRA-US/ROACTEMRA-EU.
Help start a movement for more patients
You also might be interested in:
Abbreviations: ANOVA; analysis of variance; AUC, area under the curve; AUC0-inf, area under the curve from zero to infinity; AUC0-t, area under the curve from zero to the final quantifiable concentration; CI, confidence interval; CL, clearance; Cmax, maximum observable serum concentration; EU, Europe; GMR, ratio of the geometric mean; LS-means, least square-means; PK, pharmacokinetics; rTCZ, reference tocilizumab; SD, standard deviation; t1/2, half life; Tmax, time to peak; US, United States; Vz, volume of distribution.

